Film Rental Business Analysis
Analyzing the current state of a film rental company, presenting insights, and proposing data driven business actions.

Project Overview
Context
Rockbuster, a film rental company renting physical films through brick-and-mortar stores, needs to better understand their business in order to create a plan to go digital. What does their inventory look like? Their customers? Who and what is driving revenue? They’re relying data analysis and insights to answer these questions so that they can start building a plan to transition to an online streaming service.
Purpose
Harness the power of analytics to assist Rockuster in answering questions about their current business using a combination of analytical tools and tech, including SQL, Tableau, Excel, and PowerPoint.
Deliverable
A comprehensive and compelling report of data insights, Tableau visualizations, and business suggestions, a data dictionary, and a reference guide of SQL queries and outputs used to mine the data for the insights discovered.
The Process
Step 1: Get up close and personal with the data
The beginning of any analysis project involves learning the lay of the data landscape, in this case was the structure of the Rockbuster database. Having a solid understanding of the database(s) and data you’re working with is foundational to asking questions that matter to the business and its outcomes, and effectively querying the data.
Although I have professional experience using SQL, I was challenged to better learn certain query techniques and their use cases (subqueries rather than relying on CTEs) during this phase of the project.
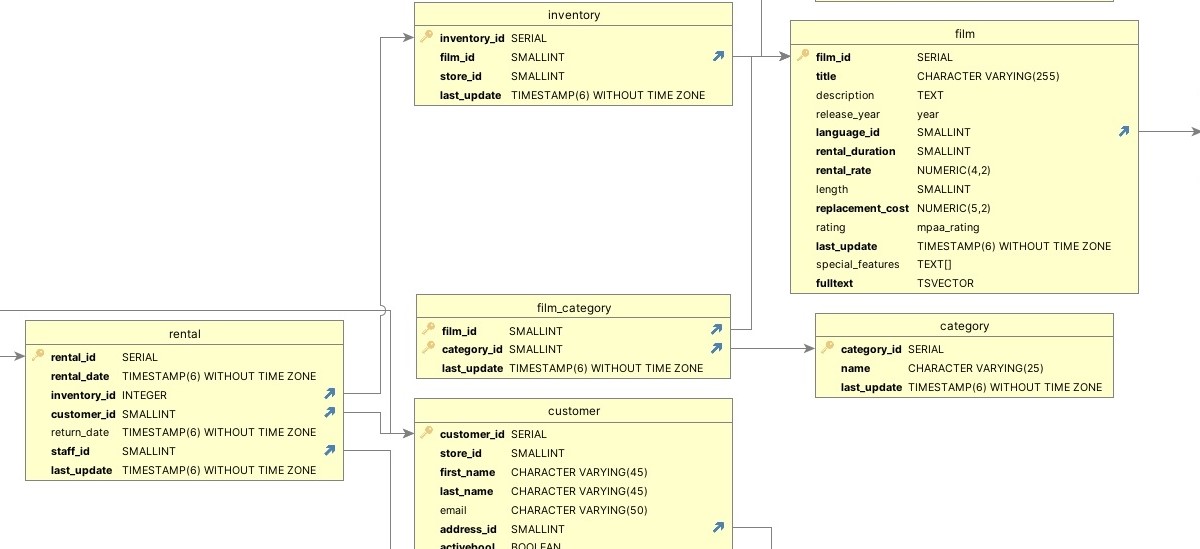
A subsection of the Entity Relationship Diagram (ERD) of the Rockbuster database
Step 2: Develop a dictionary
Documentation is important to the operation of a well run business and project, and in this step I developed a professional data dictionary for the Rockbuster database. The tools used included PostgreSQL, DbVisualizer, and SQL.
Creating a data dictionary can be a manual labor of love. There had to be a better way! And, delightfully, I learned is that you can generate the bulk of a data dictionary using a SQL Script. This ensures that your document is accurate, and manual editing time can be spent on polishing the document.
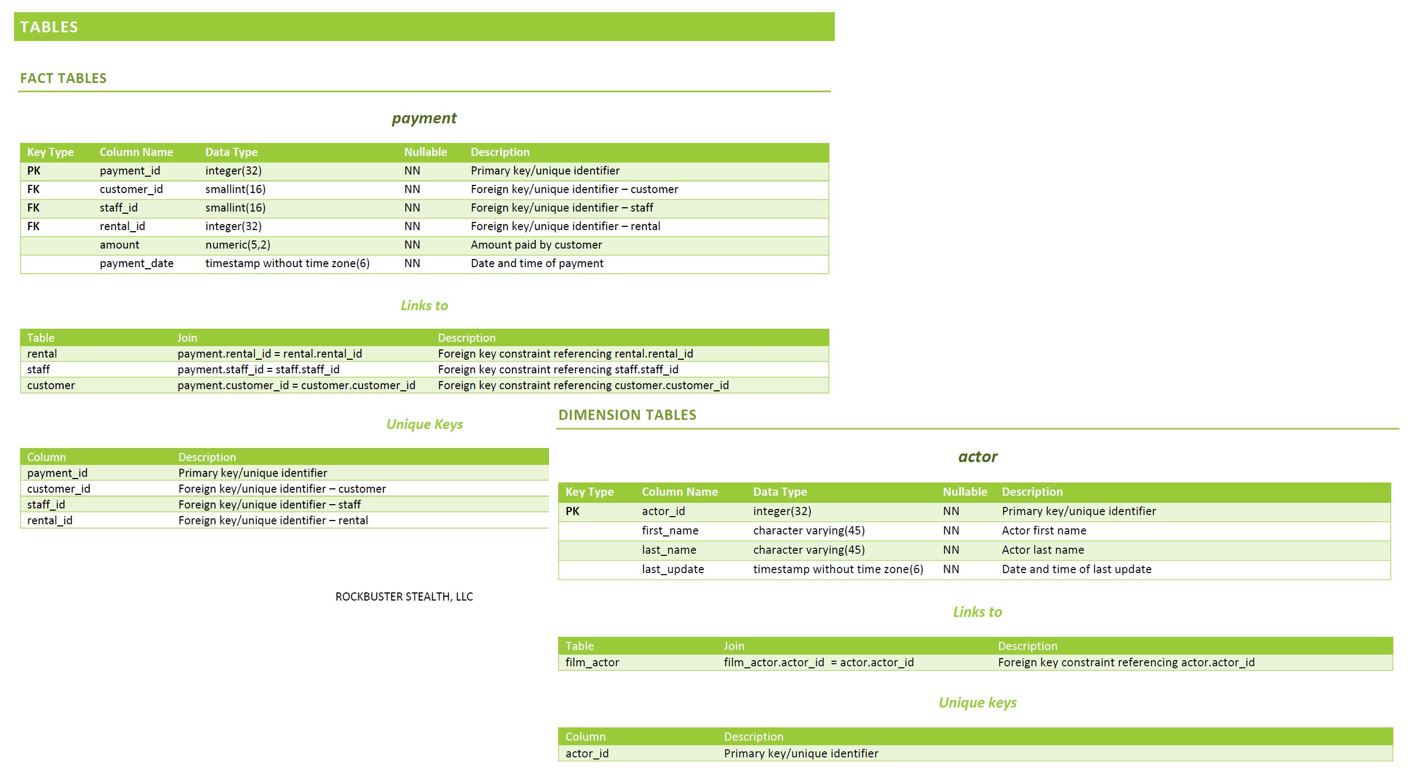
Sample pages from the Rockbuster data dictionary
Step 3: Clean house
Cleaning and filtering dirty data are a big part of a data analyst’s job. Duplicate, non-uniform, incorrect, and missing data can lead to erroneous analyses and insights. This step ensured that the Rockbuster data was accurate and wouldn’t lead to incorrect conclusions and recommendations.
I used SQL to clean the data (filtering records using common operators and clauses such as WHERE, GROUP, and IN). The result was a data set that was accurate and ready for more in-depth analyses to be performed on it.
Step 4: Ask the key questions
The Rockbuster executives wanted the following key questions answered:
- Which movies contributed the most/least to revenue gain?
- What was the average rental duration for all videos?
- Which countries are Rockbuster customers based in?
- Where are customers with a high lifetime value based?
- Do sales figures vary between geographic regions?
- Retrieved the summary statistics from relevent tables
- Used groupings, aggregations, and sorting to analyze revenue by film category, inventory, and rating
- Utilized CTEs to gather information about top customers' locations and revenue by geographic region
Step 5: Make it visual
Visualization is the ultimate way to communicate data insights, and Tableau is an amazing tool for creating informative visualizations based on the data produced by queries. Showing executives the current geographical distribution of customers and the revenue per country is much more effective than telling them verbally or in writing.
This was great practice for making the most out of the Tableau public platform, which has some limitations. For example, I would have loved to have used a Sankey Diagram to visualize the relationships and flows between film categories, ratings, and revenue, but Sankey Diagrams aren't possible using Tableau Public. Working within software limitations echoes my professional experience - you won't always have access to a full suite of analytics tools, and you’ll need to work with what’s at hand.
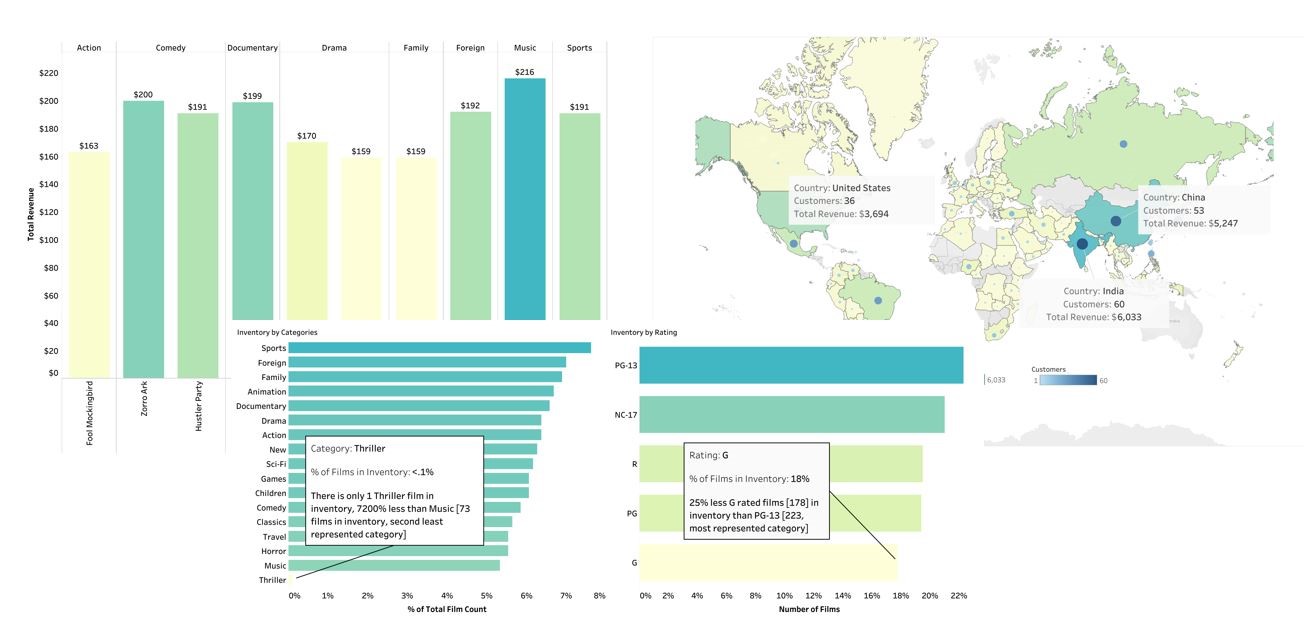
A few Tableau Public visualizations
Step 6: Tie it all together
The job of a data analyst is not simply to write SQL queries and analyze data, but also to communicate findings effectively. It sounds simple - tell the tale of what you’ve discovered. But there’s an art to effectively communicating your findings in a manner that will both get your points across and create value from the data by communicating your insights to the right people.
Data storytelling is a skill that I’m continually striving to improve on. I work to ensure that my reports:
- Are directed towards the intended audience, using appropriate language and demonstrating how the data story pertains to their specific concerns.
- Structure the presentation of insights into an actual story so that the audience can follow along, rather than being lost among charts, graphs, and numbers.
- Use headlines, data points, and visuals to communicate key messages. All text should make a concise point, and text should never be present unless it serves a purpose.
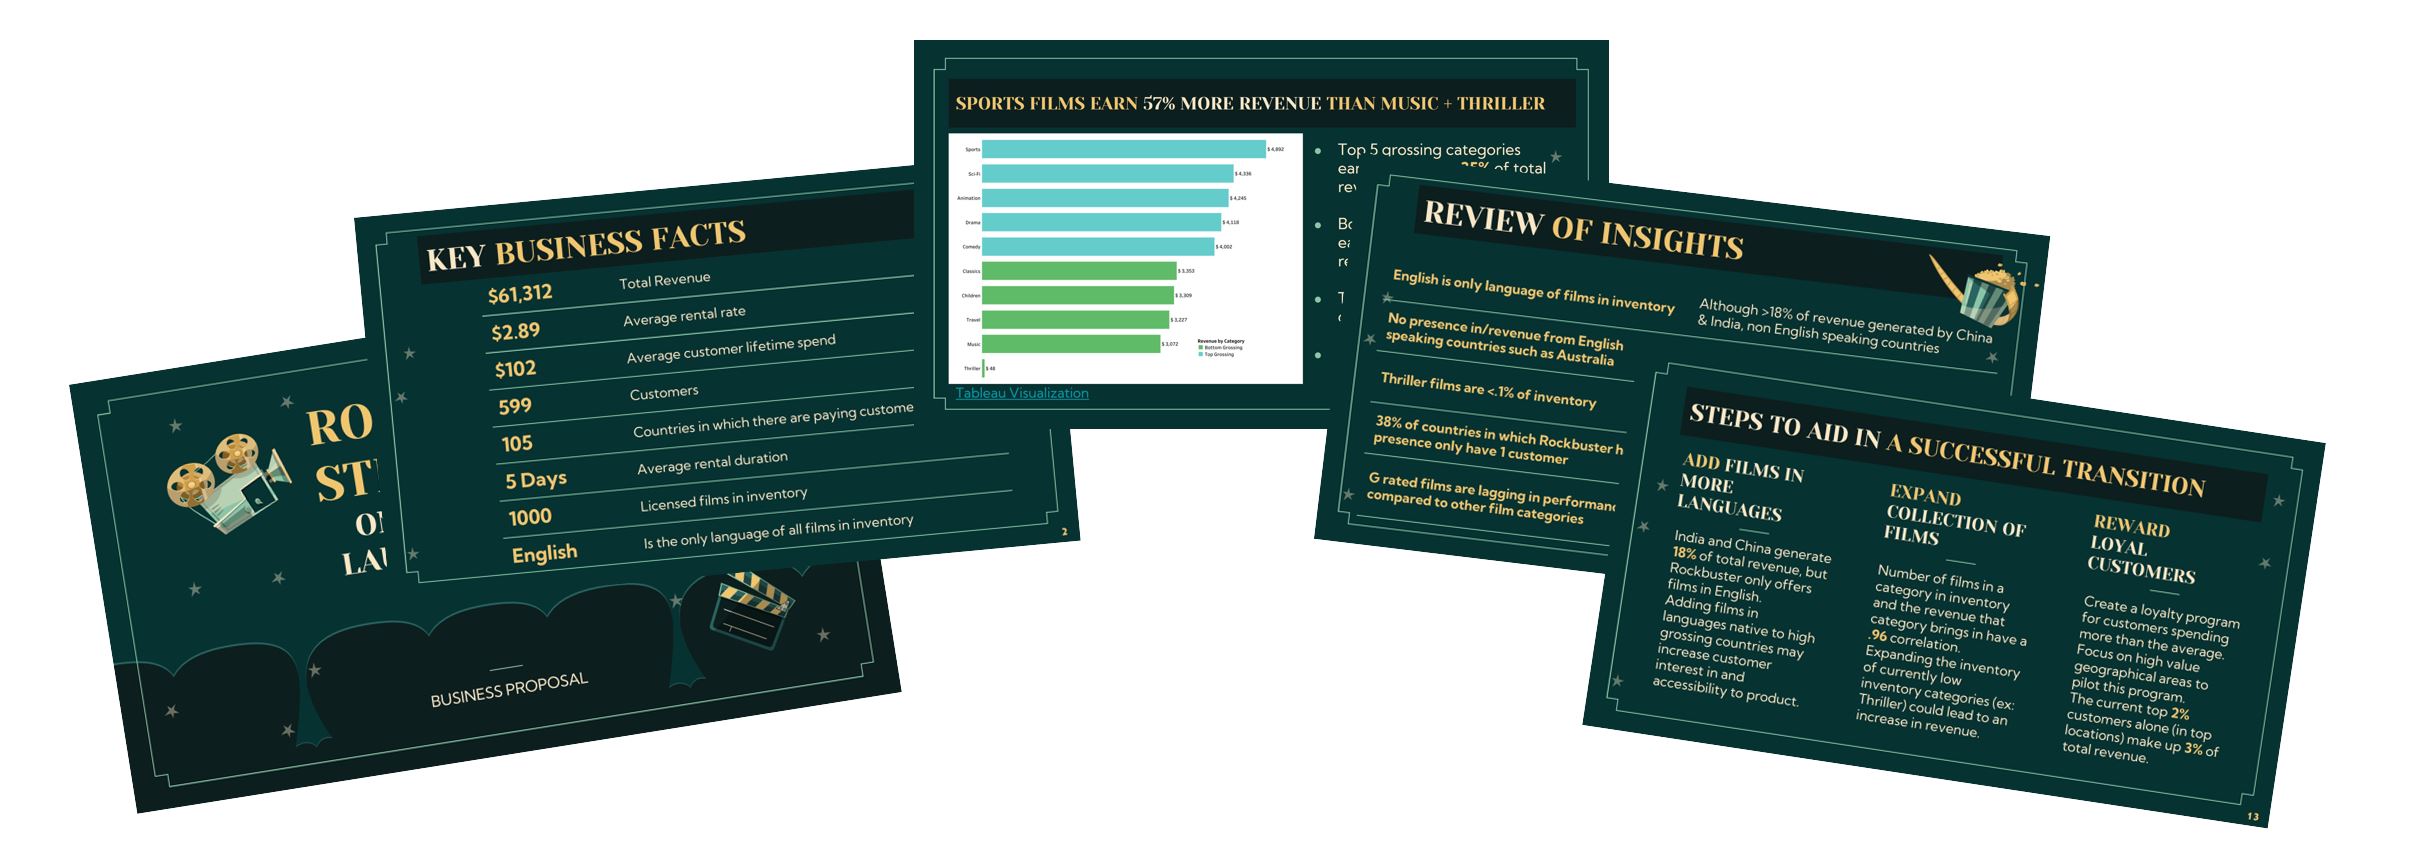
The Rockbuster business analysis deck
Outcomes
Analysis Results
Throughout this project I generated analytical insights and recommendations for next steps and further analysis that the Rockbuster executives could use to inform their strategy for a transition to online services.
Insights:
- English is only language of films in inventory, although >18% of revenue generated by China & India, non English speaking countries.
- No presence in/revenue from English speaking countries such as Australia despite 100% of films being in English.
- Thriller films are <.1% of inventory. Increasing the % of Thriller films in inventory may increase revenue from that category.
- 38% of countries in which Rockbuster has presence only have 1 customer. This data should be validated/investigated.
- G rated films are lagging in performance compared to other film categories: least represented in inventory [18%], rented 4% less time than avg rental time, for 6% less than highest (PG 13) avg rental rate
Recommendations:
- Add films in more languages: India and China generate 18% of total revenue, but Rockbuster only offers films in English. Adding films in languages native to high grossing countries may increase customer interest in and accessibility to product.
- Expand collection of films: Number of films in a category in inventory and the revenue that category brings in have a .96 correlation. Expanding the inventory of currently low inventory categories (ex: Thriller) could lead to an increase in revenue.
- Reward loyal customers: Create a loyalty program for customers spending more than the average. Focus on high value geographical areas to pilot this program. The current top 2% customers alone (in top locations) make up 3% of total revenue.
Challenges
There were certainly challenging aspects of this project:
- Learning that CTEs are not always superior to subqueries - for example subqueries can be used in a WHERE clause with IN and EXISTS - and improving my ability to write effective subqueries.
- Working within the limitations of Tableau Public and getting creative with bar charts and maps in place of using a Sankey Diagram to demonstrate relationships between variables.
- Generating valuable insights from synthetic data. For example, Rockbuster is a brick and mortar business, but their database only listed two physical locations. i therefore had to rely on analyzing customer data for insight into regional revenue, rather than looking at revenue by store location.
Learnings
If I were to repeat this project, I would:
- Conduct an analyses to determine the geographic distribution of customers’ preferences for each film category.
- This dataset was not timestamped in a way that was conducive to time series analysis, but I would attempt to use the record update timestamps in the database to give a historical analysis of revenue trends.
- Leverage my knowledge of Python to further analyze data retreived from querying the database with SQL.
Page Navigation
Deliverables
See final page of presentation for additional links